Archiv der Kategorie: Cacti

http://www.cacti.net/

Monitor temperature and humidity with DHT11 sensor on raspberry pi

The DHT11 sensor includes a temperature and a humidity sensor. I connected it with my raspberry pi and transmit the data to an external cacti server, which polls the data regularly from the raspberry pi.

Step 1: Wire the sensor

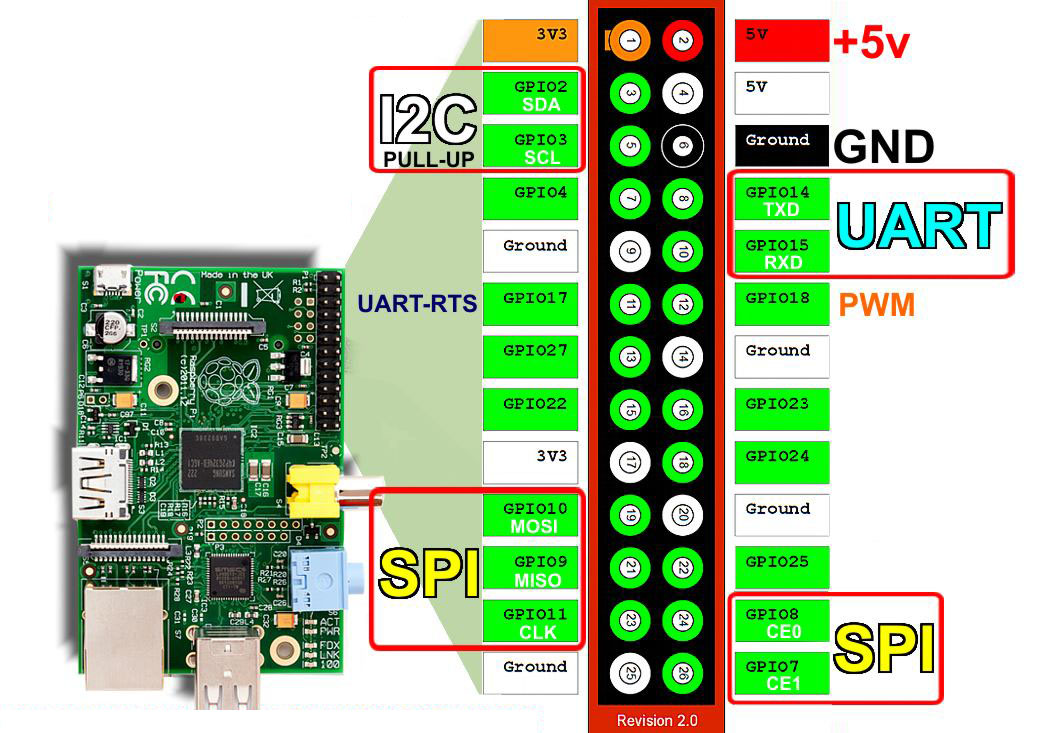
While facing the open side of the sensor (NOT the one with the sticker on it), connect the pins as following

  • Leftmost pin = V+ — connect with 3V3 (Pin 1) from raspberry pi
  • Second pin = DATA — connect with GPIO4 (Pin 7) from raspberry pi AND via a 4.7k-10k resistor with 3V3
  • Third pin = Do NOT connect
  • Rightmost pin = GND — connect with GND (Pin 6) from raspberry pi
Raspberry PI Rev2 GPIO pinout

Step 2: Get the BCM2835 library and compile / install

The latest version can always be found here: http://www.airspayce.com/mikem/bcm2835/
As the time of writing, this was 1.36

cd
mkdir -p work/bcm2835
cd work/bcm2835
wget http://www.open.com.au/mikem/bcm2835/bcm2835-1.36.tar.gz
tar xvfz bcm2835-1.36.tar.gz
cd ./bcm2835-1.36
./configure
make
sudo make install

Step 3: Get the Adafruit python code

sudo apt-get update
sudo apt-get -y install git
git clone https://github.com/adafruit/Adafruit-Raspberry-Pi-Python-Code
cd ./Adafruit-Raspberry-Pi-Python-Code
cd ./Adafruit_DHT_Driver
make

After successfully compiling the Adafruit Driver, you can check if your sensor is already working. Keep in mind that the DHT11 is SLOW and won’t react if asked more than once within 2 or 3 seconds. If you don’t get any result after the first query, wait a few seconds (at least 3) and try again. If the problem persists, your wiring might be wrong.

sudo ./Adafruit_DHT 11 4

Step 4: Modify Adafruit python code

The original Adafruit code is giving too much information for simple cacti input parameters. A modification of the source code is necessary. Along with changing the output, I also removed all references to DHT22 and AM2302 to make the file a bit smaller:

ada_sm.c

//  How to access GPIO registers from C-code on the Raspberry-Pi
//  Example program
//  15-January-2012
//  Dom and Gert
// Access from ARM Running Linux
#define BCM2708_PERI_BASE        0x20000000
#define GPIO_BASE                (BCM2708_PERI_BASE + 0x200000) /* GPIO controller */
#include <stdio.h>
#include <string.h>
#include <stdlib.h>
#include <dirent.h>
#include <fcntl.h>
#include <assert.h>
#include <unistd.h>
#include <sys/mman.h>
#include <sys/types.h>
#include <sys/stat.h>
#include <sys/time.h>
#include <bcm2835.h>
#include <unistd.h>
#define MAXTIMINGS 100
 
#define DHT11 11
 
int readDHT(int type, int pin);
 
int main(int argc, char **argv)
{
  if (!bcm2835_init())
        return 1;
 
  if (argc != 3) {
        printf("usage: %s [11] GPIOpin#\n", argv[0]);
        printf("example: %s 11 4 - Read from an DHT11 connected to GPIO #4\n", argv[0]);
        return 2;
  }
  int type = 0;
  if (strcmp(argv[1], "11") == 0) type = DHT11;
  if (type == 0) {
        printf("Select 11 as type!\n");
        return 3;
  }
  int dhtpin = atoi(argv[2]);
  if (dhtpin <= 0) {
        printf("Please select a valid GPIO pin #\n");
        return 3;
  }
  readDHT(type, dhtpin);
  return 0;
} // main
 
int bits[250], data[100];
int bitidx = 0;
 
int readDHT(int type, int pin) {
  int counter = 0;
  int laststate = HIGH;
  int j=0;
 
  // Set GPIO pin to output
  bcm2835_gpio_fsel(pin, BCM2835_GPIO_FSEL_OUTP);
  bcm2835_gpio_fsel(pin, BCM2835_GPIO_FSEL_OUTP);
 
  bcm2835_gpio_write(pin, HIGH);
  usleep(500000);  // 500 ms
  bcm2835_gpio_write(pin, LOW);
  usleep(20000);
 
  bcm2835_gpio_fsel(pin, BCM2835_GPIO_FSEL_INPT);
 
  data[0] = data[1] = data[2] = data[3] = data[4] = 0;
 
  // wait for pin to drop?
  while (bcm2835_gpio_lev(pin) == 1) {
    usleep(1);
  }
 
  // read data!
  for (int i=0; i< MAXTIMINGS; i++) {
    counter = 0;
    while ( bcm2835_gpio_lev(pin) == laststate) {
        counter++;
        //nanosleep(1);         // overclocking might change this?
        if (counter == 1000)
          break;
    }
    laststate = bcm2835_gpio_lev(pin);
    if (counter == 1000) break;
    bits[bitidx++] = counter;
 
    if ((i>3) && (i%2 == 0)) {
      // shove each bit into the storage bytes
      data[j/8] <<= 1;
      if (counter > 200)
        data[j/8] |= 1;
      j++;
    }
  }
 
  if ((j >= 39) &&
      (data[4] == ((data[0] + data[1] + data[2] + data[3]) & 0xFF)) ) {
     if (type == DHT11)
        printf("temp:%d hum:%d\n", data[2], data[0]);
    return 1;
  }
 
  return 0;
}

Compile the file with this command line (if you saved the above .c-file as „ada_sm.c“)

gcc ada_sm.c -l bcm2835 -std=gnu99 -o ada_sm

The output should be compatible with cacti:

$ sudo ./ada_sm 11 4
temp:23 hum:33

Step 5: Add a socat service

I’ve explained how to achieve this in another post, you only need a new shell script which will make sure that the readouts were given:

/usr/local/bin/dht11.sh

#!/bin/bash
result=""
while [ -z "${result}" ];
do
result=$(sudo /home/pi/work/dht11/ada_sm 11 4)
sleep 3
done
echo ${result}

Here the contents the configuration file for socat:

/etc/default/socat

OPTIONS="-T 30 -t 30 tcp-l:9889,reuseaddr,fork,crlf system:\"/usr/local/bin/dht11.sh\""

Step 6: Read data from the socat service on the cacti host

This is explained in another post as well, but the needed script in the site/scripts-directory is a bit different, here’s what I used. Keep in mind that you have to change „PI-IP“ to your local DNS or IP-Adress of the Raspberry Pi.

/usr/share/cacti/site/scripts/dht11.sh

#!/bin/bash
outstring=$(/bin/nc PI-IP 9889  | tr -d '\r')
echo "${outstring}"

Resources on the internet

These links helped me set this up:
http://www.messtechniklabor.de/artikel-h0000-temperatur_und_luftfeuchtigkeit_messen.html
https://learn.adafruit.com/dht-humidity-sensing-on-raspberry-pi-with-gdocs-logging/wiring
http://www.airspayce.com/mikem/bcm2835/

Monitor Raspberry Pi temperature from an external server

I’m using a raspberry pi with XBMC as a mediaplayer. As I didn’t want to have a lot of trouble maintaining it, I decided to try OpenELEC. It works fine, but it’s really limited to only the media-related parts.

I wanted to know how much the temperature changes when using my raspberry pi and I already had a working cacti-server in my LAN. But what would be the best way to read the temperature from the pi without pushing too many binaries onto the system?

The answer is „socat“ – and of course, the binary is NOT part of the OpenELEC-distribution. But I was able to compile the socat as a static binary on another raspberry pi, which was runnning raspbian.

./configure LDFLAGS="-static"
make

Copy the resulting binary socat to the OpenELEC-raspberry. If you can’t create the binary yourself, you can download it from here:

socat 1.7.2.4 statically linked

socat: ELF 32-bit LSB  executable, ARM, EABI5 version 1 (SYSV), statically linked, for GNU/Linux 2.6.26, BuildID[sha1]=8ca6f5b38a7836cefe0721295d946dd9f90fb98e, not stripped

Put the socat in a new directory called /storage/tempservice/.

Add the following two files in the same directory /storage/tempservice/:

socat-service.sh

#!/bin/bash
/storage/tempservice/socat -T 1 -d -d tcp-l:9888,reuseaddr,fork,crlf system:"/storage/tempservice/t.sh"

t.sh

#!/bin/bash
cat /sys/class/thermal/thermal_zone0/temp

socat-service.sh will later start the service, while t.sh reads the temperature itself.

To make sure that the service is started on startup, we introduce a new system service in system.d: Change to the directory /storage/.config/system.d and add the following file:

socat.service

[Unit]
Description=SocatTempServer
 
[Service]
Type=simple
ExecStart=/storage/tempservice/socat-service.sh
 
[Install]
WantedBy=multi-user.target

And enable the service:

systemctl enable socat.service

Reboot and test from the other system in the LAN whether we can read the temperature:

nc PI-IP 9888 | tr -d '\r'

Now all you have to do is include the result in a cacti script and show the result. 🙂

Here’s what it may look like:

An example for a cacti picture measuring raspberyy pi temperatures
An example for a cacti picture measuring raspberry pi temperatures

Prepare a self-written script and include the data in CACTI

I’m using cacti to keep track of Inbound and Outbound Traffic, Load on the Linux Server, Ping-Time to my webserver in the internet, etc. But I also use it for other everyday usages, like „How many users are on my TS3-Server?“ or „How much power does my desktop system consume?“

For these type of questions, I’ve written some scripts which output a single information. These scripts can be written in different languages, like perl or php, but I prefer writing them directly in bash.

Here’s an example which keeps track of how many users are on my TeamSpeak 3 Server at any given time:

#!/bin/bash
PASSWORD="yourpassword"
TS3HOSTNAME="localhost"
arr=($(echo "use sid=1
login client_login_name=serveradmin client_login_password=${PASSWORD}
serverinfo" | nc ${TS3HOSTNAME} 10011 | grep virtualserver_clientsonline))
for ((i=0; i<${#arr[@]}; i++))
do
        if [[ ${arr[${i}]} == virtualserver_clientsonline* ]]; then
                now=$(sed 's/virtualserver_clientsonline=//' <<< ${arr[${i}]})
                let "now -= 1"
                echo "now:${now}"
                break
        fi
done

The output is simply „now:3“, when three users were logged in at that time. As our connect to the TS3-server also counts, we must decrease the number of clients (let "now -= 1").

When the script works as expected, put it into the CACTI-scripts-directory:

/usr/share/cacti/site/scripts

And make sure that it is executable by the cacti user (i.e. make it executable for everyone):

root@host:/usr/share/cacti/site/scripts# ls -lA ts3.sh
-rwxr-xr-x 1 root root 388 Sep 26 11:22 ts3.sh

Now log into your cacti, switch to the console-tab and follow these steps:

  1. Data Input Methods: Add a new one, reference to the script (Input Type: Script/Command) with this Input String: /bin/bash /scripts/ts3.sh
    Make sure to add all „Output fields“ as well, these are the data that’s coming from your script. In the example of TS3-Users above, this would me „now“.
  2. Data Template: Choose as „Data Input Method“ the just added Data Input Method. As „Data Source Item“ create ALL which are relevant for this graph, choose the fields which were created in step 1 accordingly as Output Field.
  3. Graph Template: Create all necessary graphs. Remember that you can easily peek at other graphs which values might be useful: The Graph itself („AREA“) and the printed values below („GPRINT“).
  4. Data Sources: Add our Data Template as a Data Source. Remember to SAVE.
  5. Graph Management: –> ADD, the newly created Data Sources are available now.
  6. Devices: Associated Graph Templates: Add the new template (from 4) to the device